

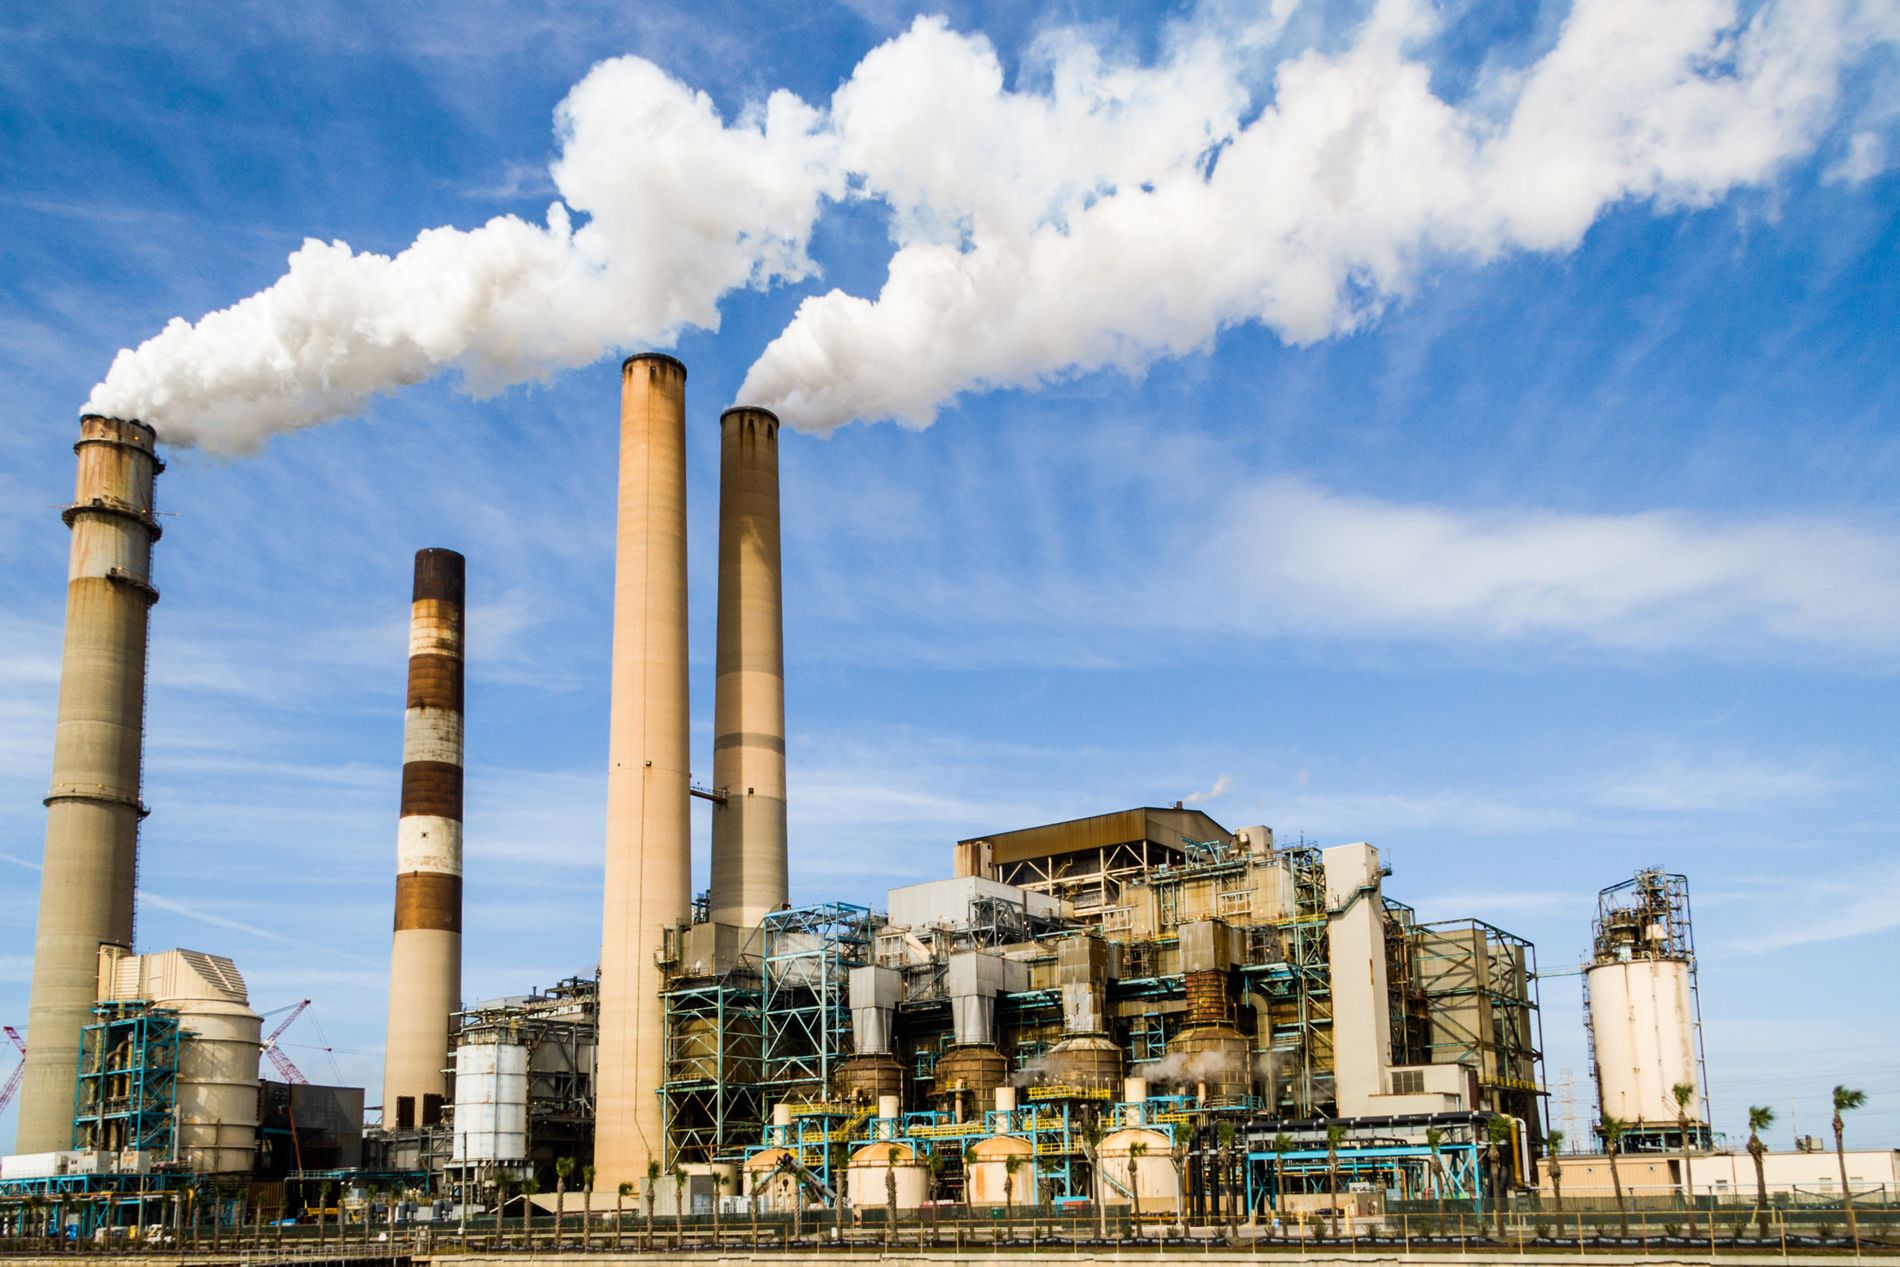
Predict risk.
Protect value.
Every month we score industrial units, buildings and diversified portfolios for heat, flood, water stress and storm exposure. Our 10 year predictions make it possible to act on the risks in-time, protecting capital and lives.
Ranked #1 globally by UNIDO · Stress-tested against 100Mn tonnes of steel production
Asset Owners, Insurers, Financiers & Regulators
While, in many instances, climate data is available with these key stakeholders, it is not continuous, harmonised or investment-grade. This data may be good enough for reporting but it is not good enough to make business, investment or insurance decisions. Emissions sit in one system, climate risk in another and operations in a third. There is no single integrated view for a plant, building or region you’re about to lend against, buy, run, insure or sanction approvals for.
DEFINE was built to solve this problem by providing a continuous, harmonised and investment-grade data layer for financial decisions. DEFINE’s data is built from satellite emissions, IPCC aligned science and real plant data, so lenders, owners and buyers can price the decision, not just file the report.
Underwrite actual asset-level exposure.
Price a policy on the hazard schedule of the site itself, not the postcode. Monthly scores mean the book re-rates as the risk moves, not once a year.
Asset-level Data for 1M+ assets globally
Satellites see a region. They do not see an asset. DEFINE’s models separate one plant’s signal from the traffic, the weather and the plant next door, then convert it into tonnes: CO₂, methane, heat and aerosols, site by site. No survey, no self reported inventory, no disclosure cycle.
Based on temporal & geographic patterns emerging from the last 2.5 decades, we predict climate events 10 years out. IPCC-aligned asset-specific risk profiles are auto-generated by DEFINE.
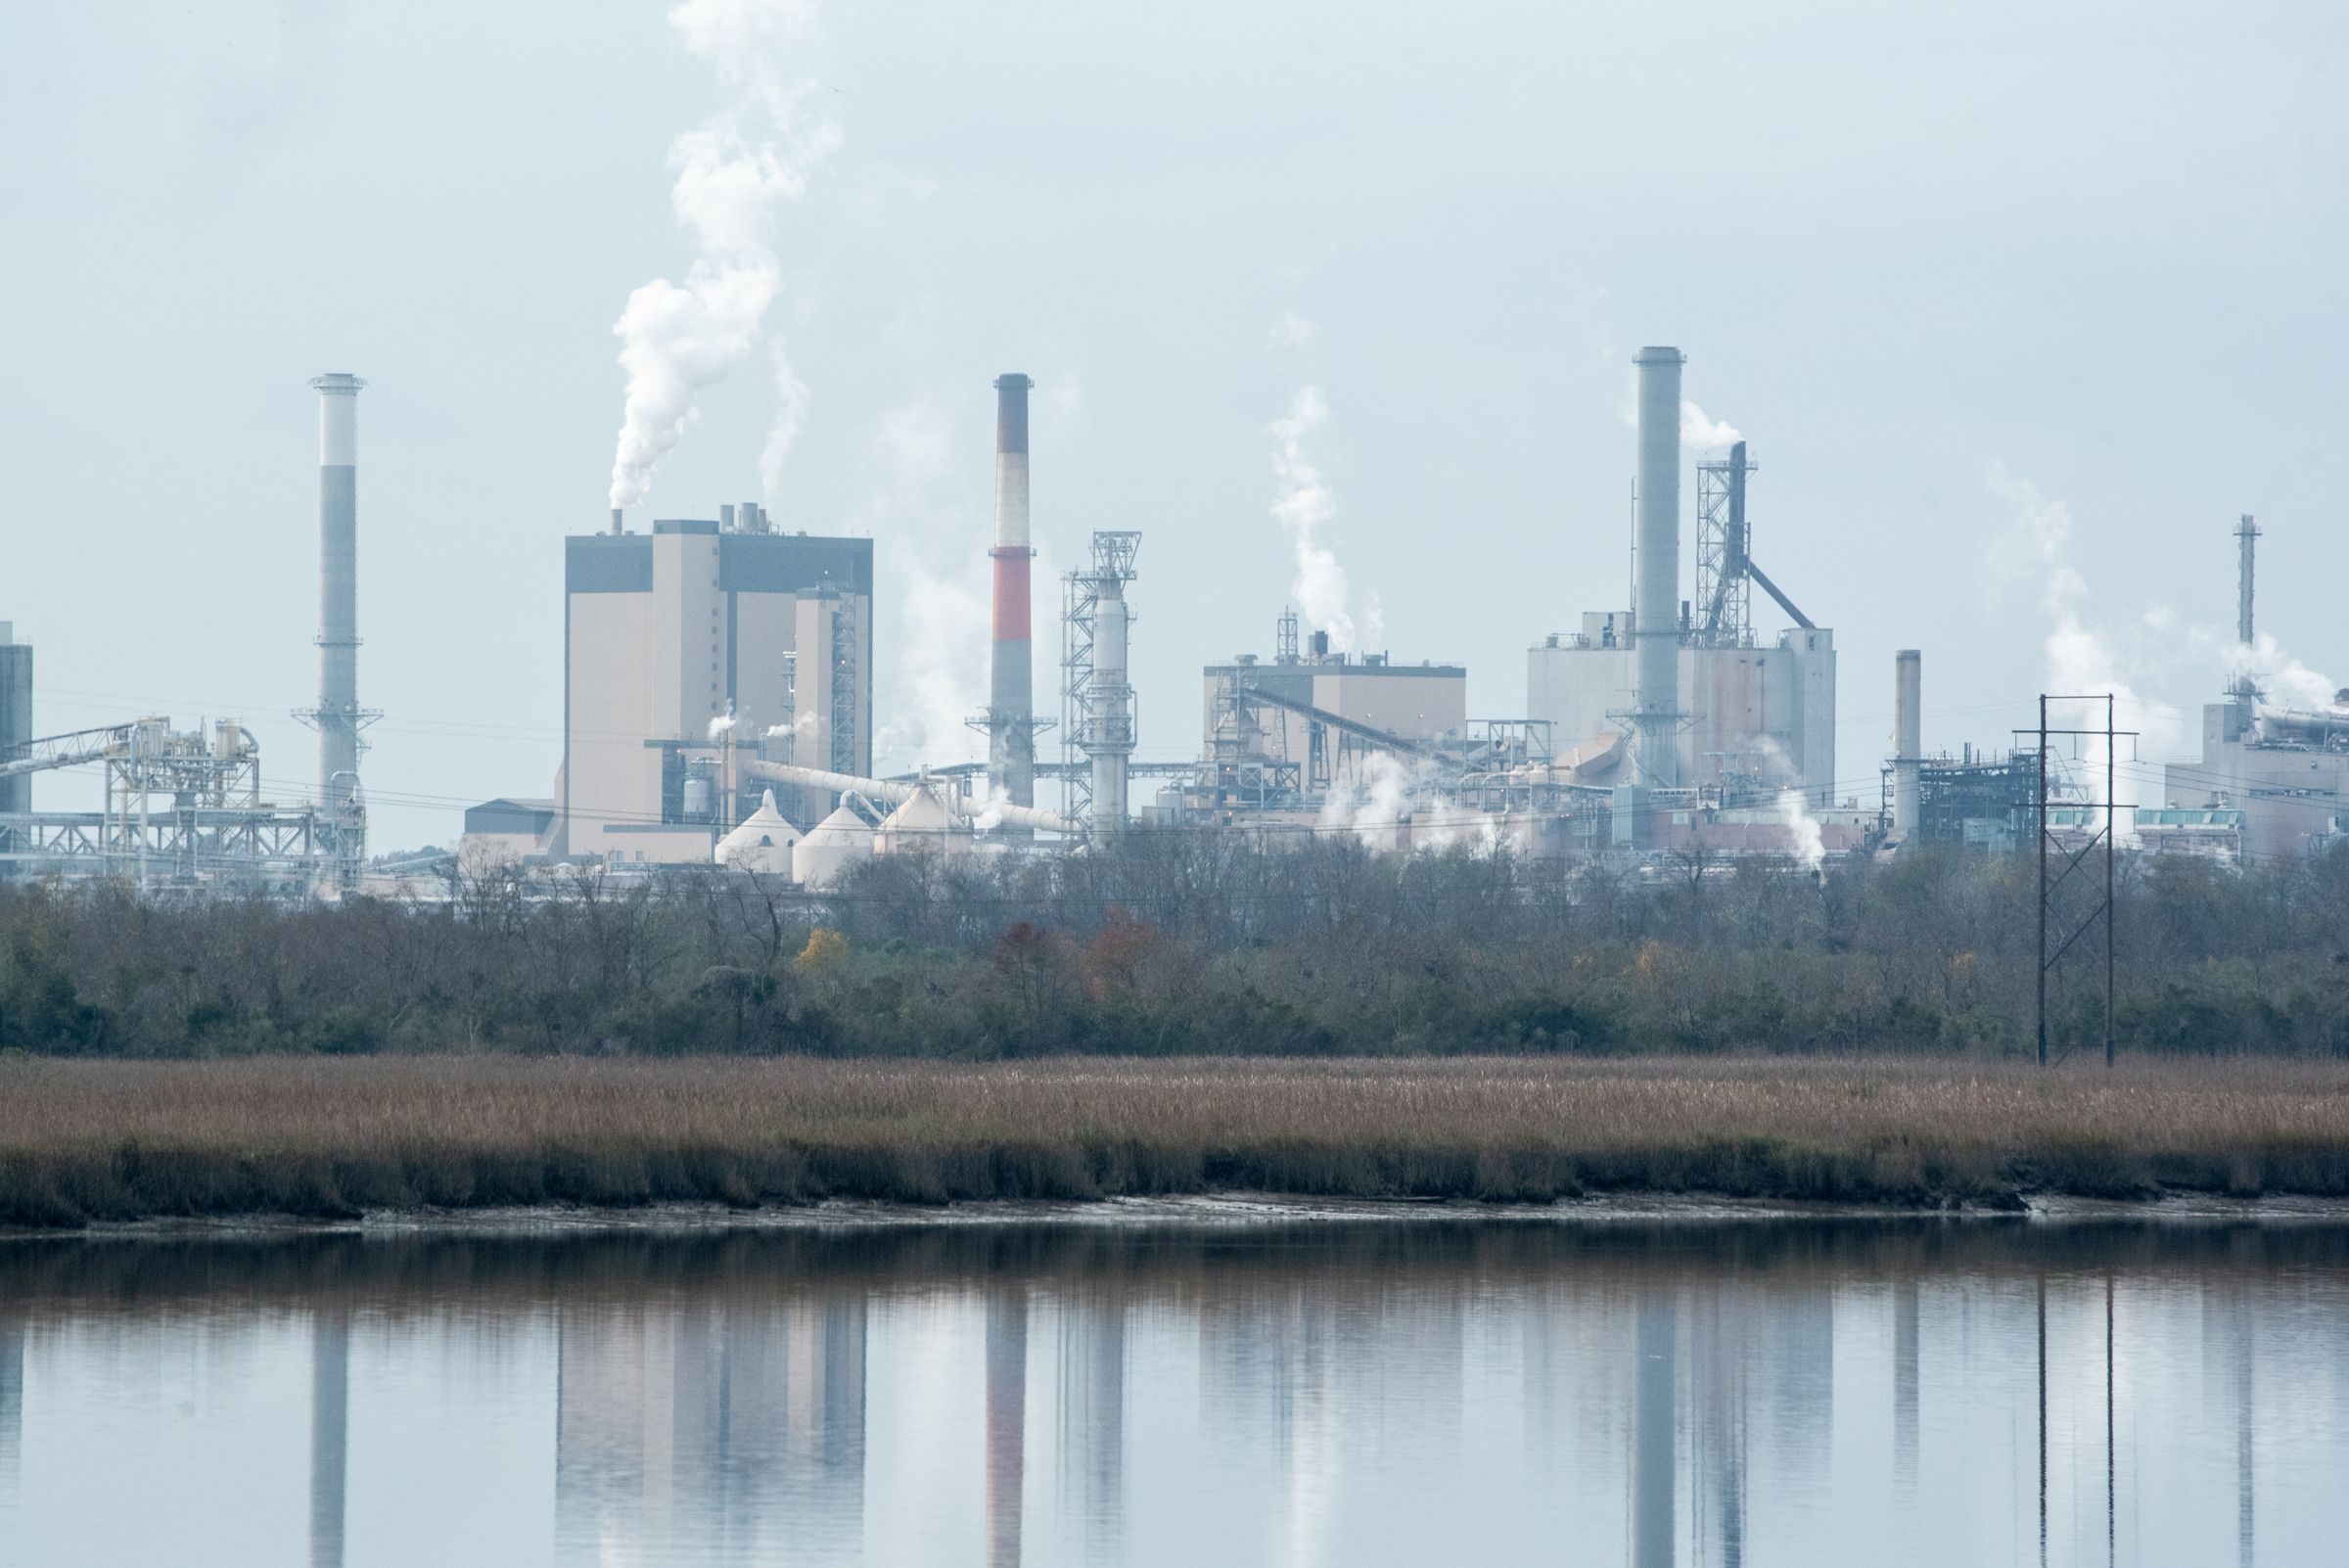
The live observation loop · real plants, illustrative estimates, not live data
High emissions vs. high exposure.
One asset emits heavily and faces a carbon bill. Another emits almost nothing and faces the sea. Emissions data alone misprices both.
An integrated steel works emits roughly two tonnes of CO₂ per tonne of steel. Carbon pricing and border levies attach a cost to each of those tonnes. Physical risk at the site is moderate; the cost of production is what rises.
A coastal tower emits very little, but sits in a surge zone whose return period is shortening. Premiums rise, cover is withdrawn, then the valuation falls. Its emissions data shows none of this.
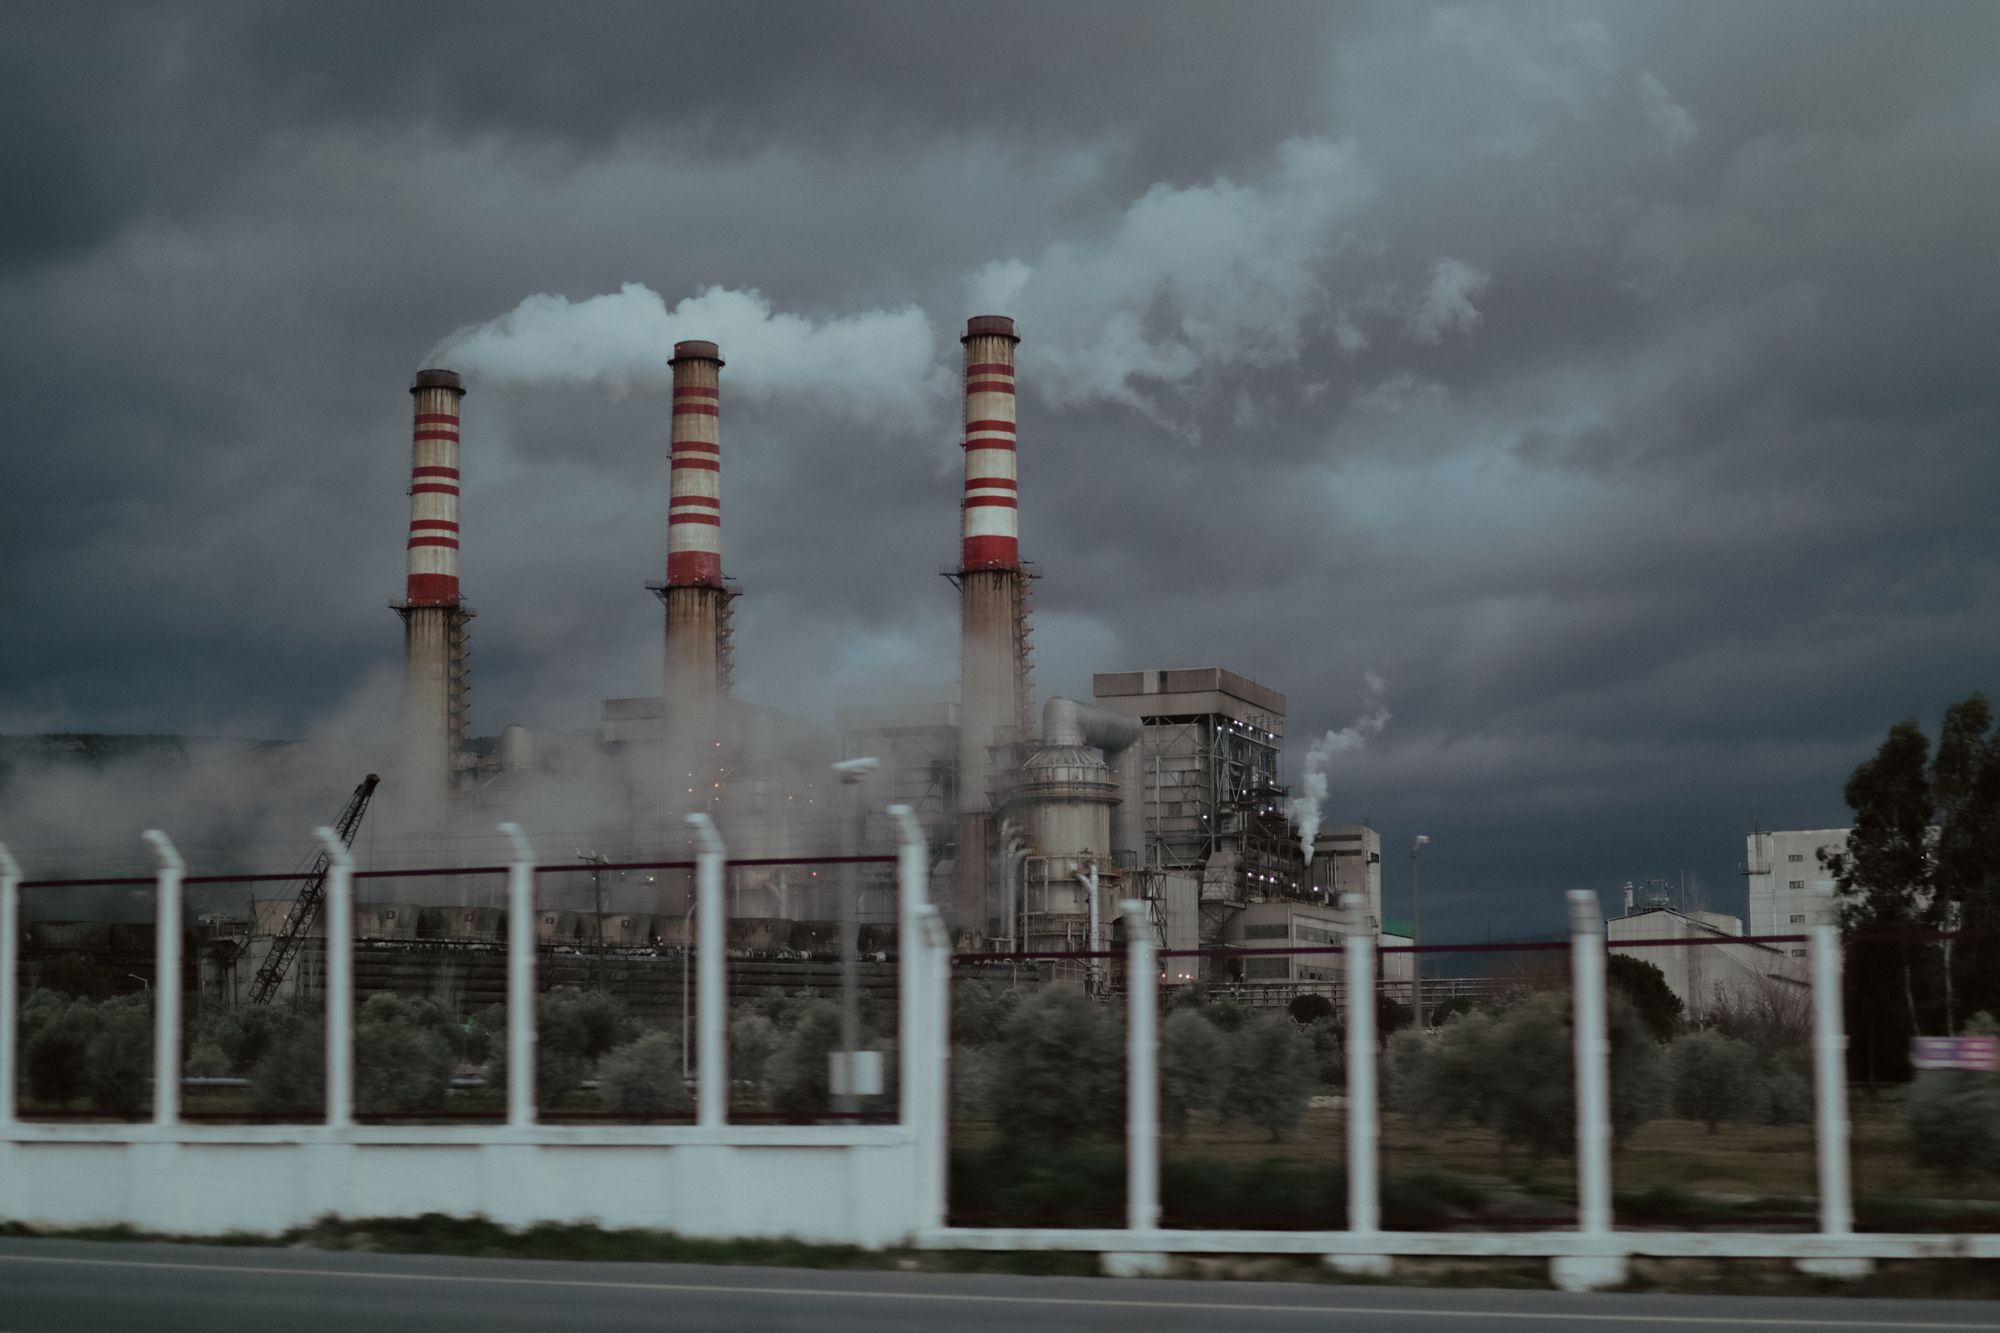
High emissions result in border levies, financed emissions reporting at the lender and brown discounts. Combined with high physical risk, this can make an asset a poor investment candidate regardless of past financial performance.

Low emissions give no protection from surge. High climate risk, regardless of emissions profile, might require action to protect asset value before events hit the asset. Insurance re-rates and lending terms follow. Access and workforce are lost and the supply chain is disrupted before the building is damaged.
Most climate data answers one of those two questions. DEFINE answers both, for the same asset, every month.
What a rising risk score means on the ground.
Each score on DEFINE resolves to a site and a month: a week in May when the furnace crew cannot safely work, a September when the access road floods and trucks stop. DEFINE is not a weather app. Ten year predictions provide enough time needed to refinance, retrofit, rebuild or relocate.
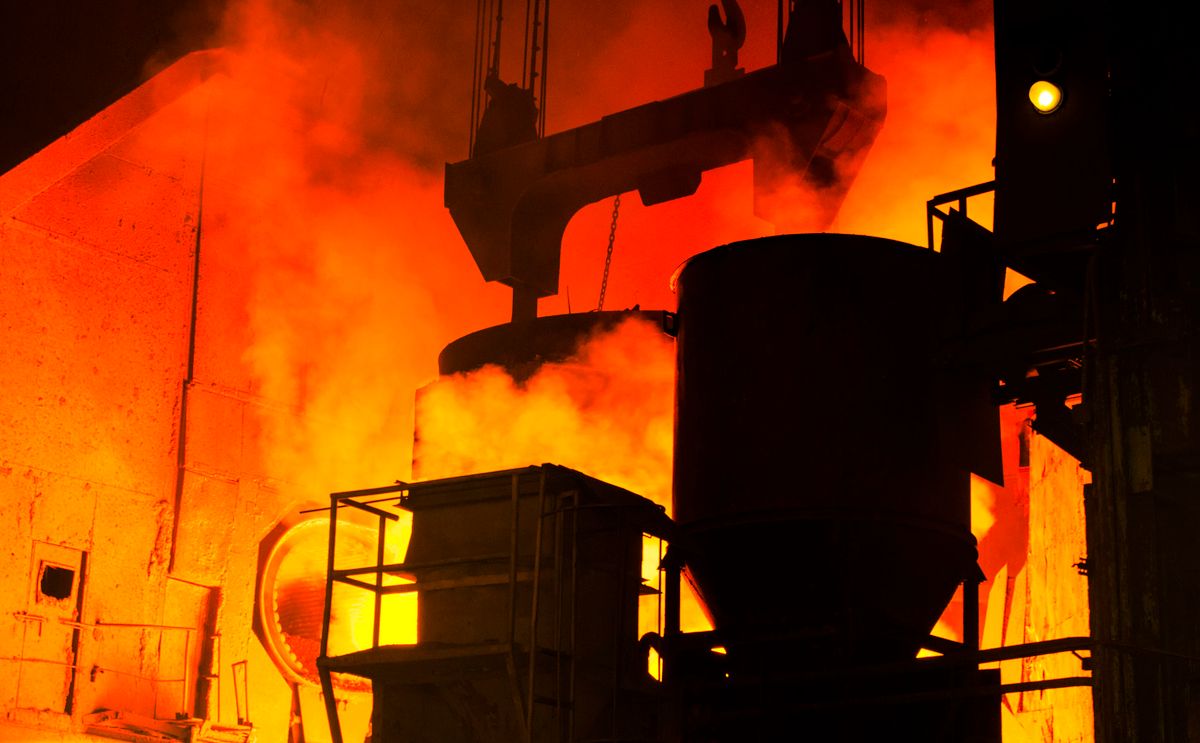
Inside the fence line
Early predictions before shifts are cut first, health insurance spikes and equipment needs cooling.

Outside the fence line
A flood that reaches a warehouse also closes the road to it. Access and workforce are lost before the building is damaged.
Downwind from the asset
The emissions plume we measure is the same air a town breathes. One reading, two liabilities: the carbon bill and the health cost.
From a satellite reading to a ten year forecast.
DEFINE brings together observed and primary data to form the full picture. The model incorporates how the asset operates, what a site emits and how local climate will evolve based on local emissions & global context.
Next, the model estimates actual impact of local climatic conditions on the asset. Pattern matching against comparable sites and their hazard histories produces a forward curve. As the asset improves, DEFINE automatically recalibrates the risk.

What the asset emits
Machine models read CO₂, methane, heat and aerosol signals above every site we track. No site visit and no permission required.

What the climate will do to it
Global climate models brought down to this one location, under three IPCC pathways: heat, flood, water and storms.
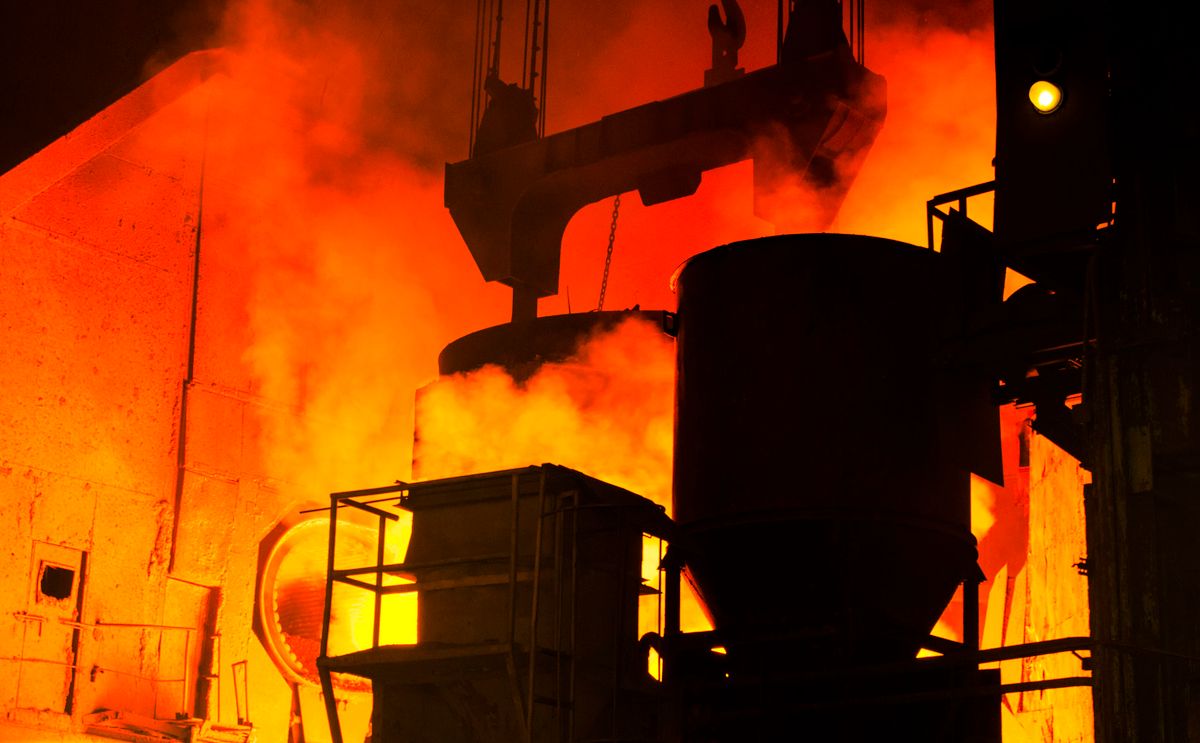
How the site actually runs
Real production, process and energy data, checked on the ground, including ~100 MT of steel verified alongside the regulator.
Prioritise assets for decarbonisation.
Risk is not spread evenly. In most portfolios a small number of sites carry most of the exposure, and they are not always the sites capital is already allocated to.
Ranking each site by how fast its risk is rising against what abatement costs turns a decarbonisation plan into a spending order.
Trusted where the stakes are highest.
Regulatory & Policy AI
Ranked the #1 implemented solution by UNIDO and Anthropic.
India’s Ministry of Steel
Around 100 MT of steel emissions validated on-site with the regulator.
RBI Regulatory Sandbox
Sustainable finance & credit-risk pricing cohort.
NITI Aayog Growth Hubs
Powering regional climate-risk simulation.
See it on your own portfolio.
Name a plant, a building or a list of assets. We run it live and show the risk score, the hazards behind it and what the exposure is worth, month by month to 2036.
Enterprise platform. Pricing depends on assets, data needs and use case.